
Every once in a while, a home run hits the group chat harder than it hits the seats. Shohei Ohtani’s rocket against the New York Mets did exactly that, not only because it left in a hurry, but because modern tracking tools let us explain why it left the way it did.
MLB’s Statcast gives us two angles that matter if you care about more than the replay: the measured distance behind the shot and bat-tracking that shows what Ohtani’s swing was doing through the zone. Put those together and you get the real story: this was not just “he ran into one.” It was contact quality plus a swing path that gave the ball a clean runway.
The Statcast line: 118.7 mph exit velocity, 455 feet projected distance, 24° launch angle. Bat tracking tagged it with a 78.2 mph bat speed.
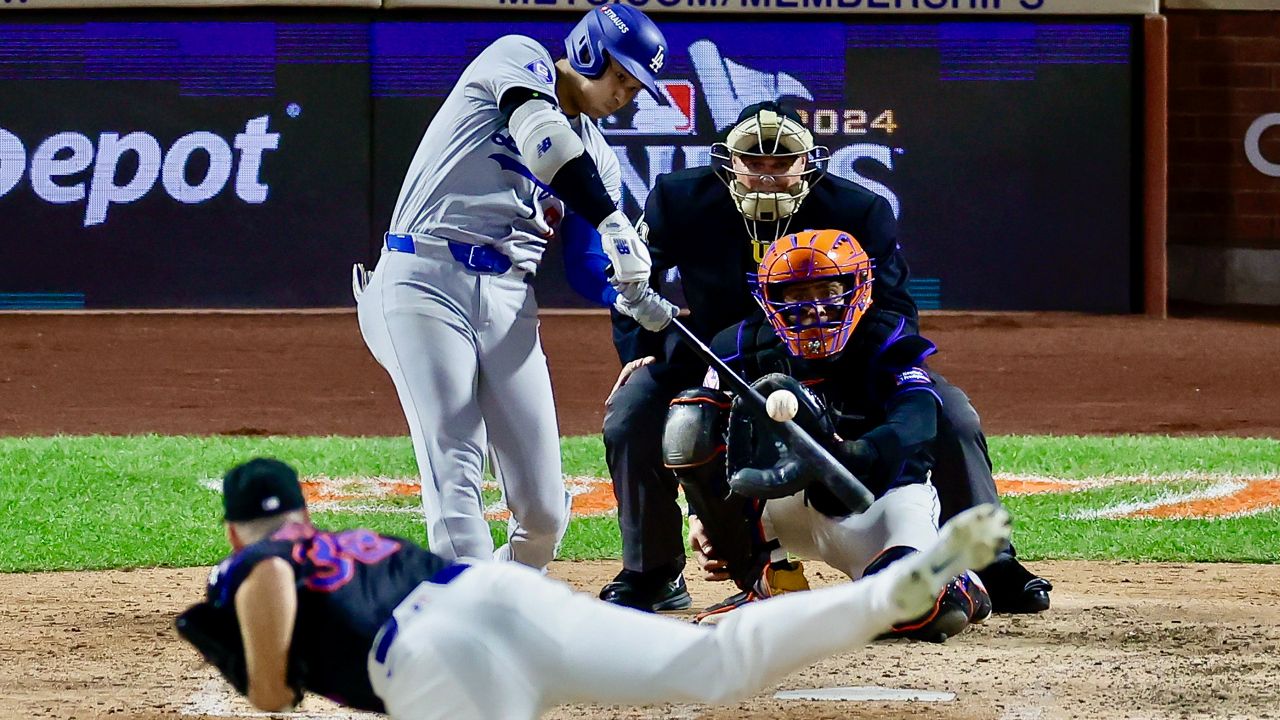
Distance data
Fans love a distance number because it feels like the purest brag. But “how far” is a little more nuanced than most broadcasts make it sound.
Carry vs landing
Statcast’s projected distance is modeled off the batted-ball inputs, mainly exit velocity and launch angle, then it is reconciled against the real-world environment. That matters because stadium geometry can trick your brain. A ball that clears a tall wall can look shorter than one that lands on a flatter, deeper part of the park even if the tracked distance says otherwise.
Why big distance happens
When a homer posts up as a true “distance” shot, it usually signals one of two things:
- Elite contact: the ball left the bat with enough speed to stay on a strong trajectory even as it started to lose lift.
- Efficient launch: the hitter got the ball in the air at an angle that maximizes flight without turning it into a can of corn.
Ohtani’s checks both boxes. 118.7 mph is rare air, and 24° is the kind of angle that turns raw force into carry. Add the 455-foot projection and you are no longer talking about “just enough.” You are talking about a ball that was built to leave.
Bat tracking
Traditional Statcast tells you what happened to the ball. Bat tracking starts answering what happened to the bat. That distinction is huge for understanding a hitter like Ohtani, whose damage often comes from making the barrel arrive on time, at speed, with a path that does not waste motion.
Three metrics to know
- Bat speed: how fast the barrel is moving at contact. More bat speed can create damage even when the pitch is not perfect.
- Attack angle: the vertical angle of the bat through the zone. When it matches the pitch plane well, you get a longer, cleaner contact window.
- Time in the zone: how long the barrel stays in a hittable path. This is the quiet difference between “I had to be perfect” and “I gave myself room.”
On this swing, the headline number is simple: 78.2 mph bat speed. That is the kind of fast that shrinks the margin for the pitcher. Pair it with the batted-ball output and you get the most important takeaway for hitters and coaches: the result was loud because the process was clean.
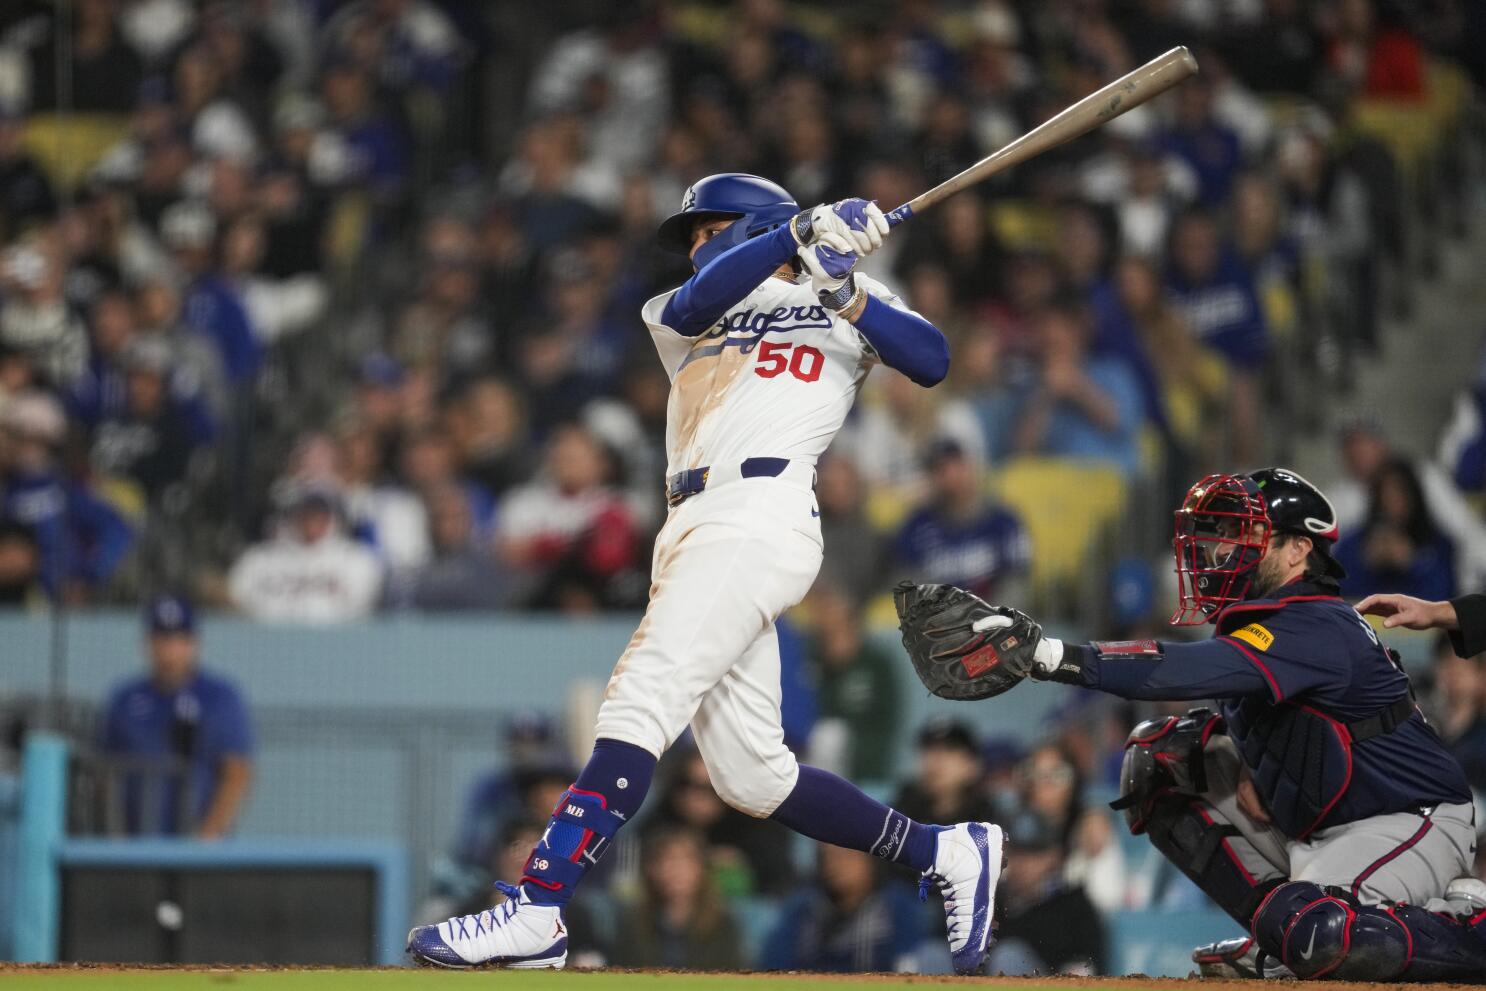
What he did
Without turning this into a lab report, here is the practical read from a player’s seat: Ohtani’s homer looked like a swing that stayed connected, got the barrel out front, and finished with lift that turns hard contact into guaranteed seats.
Barrel access
Plenty of big leaguers can hit a ball hard. The separating skill is getting the barrel there consistently with a path that creates the right launch. That is why the combo of 118.7 mph and 24° matters. It is not just power, it is power organized into flight.
The timing window
Bat tracking is useful because it hints at how repeatable the swing is. A hitter who creates a wider timing window can punish more pitch types and more locations. When you can move the barrel that fast and keep it on plane, the pitcher is the one who has to be perfect.
Why it matters
Home runs go viral every day. The reason this one sticks is that it offers two kinds of proof at once: the ball went a long way, and the swing metrics explain why it had no choice but to.
And it is a clean example of what tracking data is for. The video gives you the feeling. The numbers tell you whether the feeling is backed by something repeatable. In this case, it is.
Quick FAQ
Is projected distance the same as where it landed?
Not always. Projected distance is a modeled estimate of the ball’s flight based on measured inputs. Where it lands can be influenced by walls, angles, and the specific geometry of the park.
What does bat speed add?
Exit velocity tells you the result. Bat speed helps explain the process. It is one of the clearest indicators of how much raw “engine” a swing brought to the contact point.
Does one huge homer mean a hitter figured it out?
Not by itself. But when a big result lines up with clean traits like high bat speed and an efficient launch window, it is a better sign than a one-off wall-scraper. Repeatable is where real production lives.